Debug for Coverage and Sourcemap
Sometimes, the coverage is not what we expect. The next step is to figure out why, and we can easily find out the answer step by step through debugging.
Start debugging for v8 report
Start debugging for v8 report with option logging: 'debug'
js
const coverageOptions = {
logging: 'debug',
reports: [
['v8'],
['console-details']
]
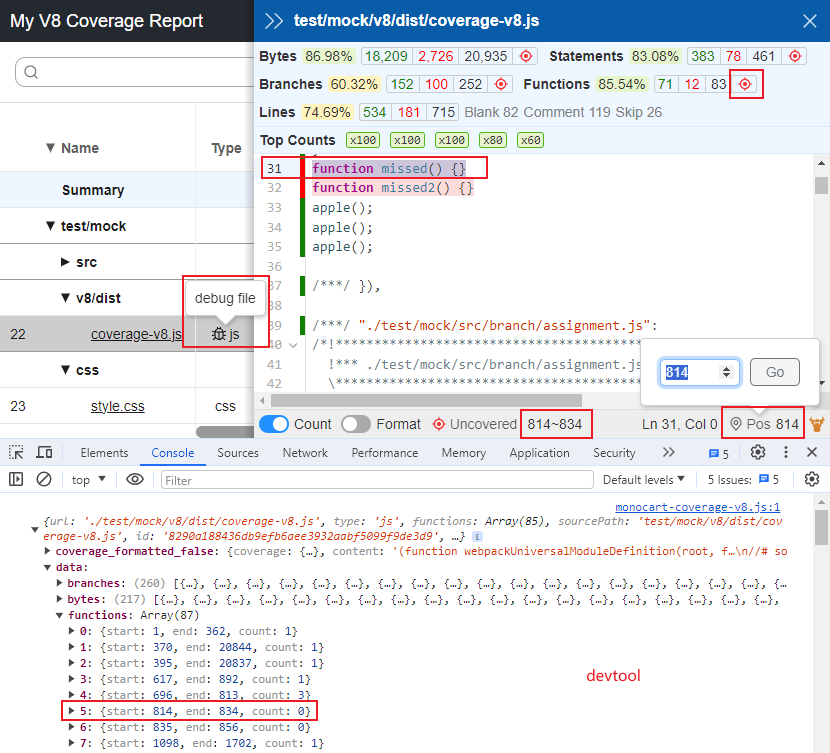
};When logging is debug, the raw report data will be preserved in [outputDir]/.cache or [outputDir]/raw if raw report is used. And the dist file will be preserved in the V8 list, and by opening the browser's devtool, it makes data verification visualization effortless.
Check sourcemap
Check sourcemap with Source Map Visualization
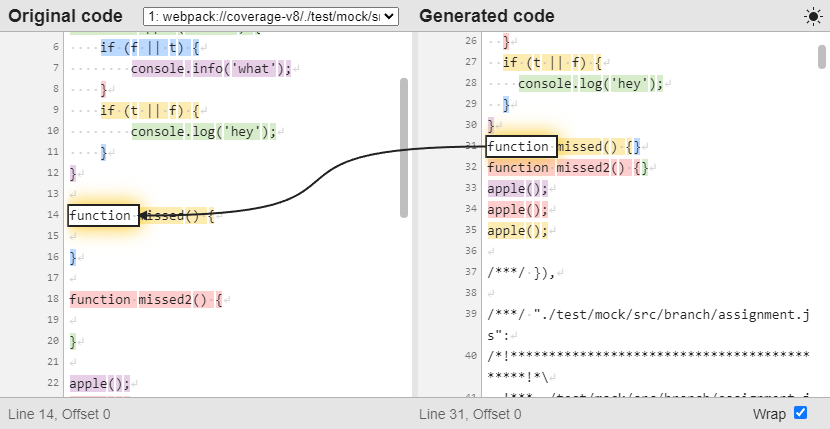
Generate additional files
Generate additional source and sourcemap files to cache or raw dir
js
const coverageOptions = {
    logging: 'debug',
    sourceMap: true
};
Show time logs
Show time logs with env MCR_LOG_TIME
js
process.env.MCR_LOG_TIME = true